For this data visualization project we used a data set about released Spotify tracks. This data set contains metrics such as Tempo, Length, Popularity, Release Date, and Danceability. Using this data set we were able to answer many questions a presentation of which is explained below.
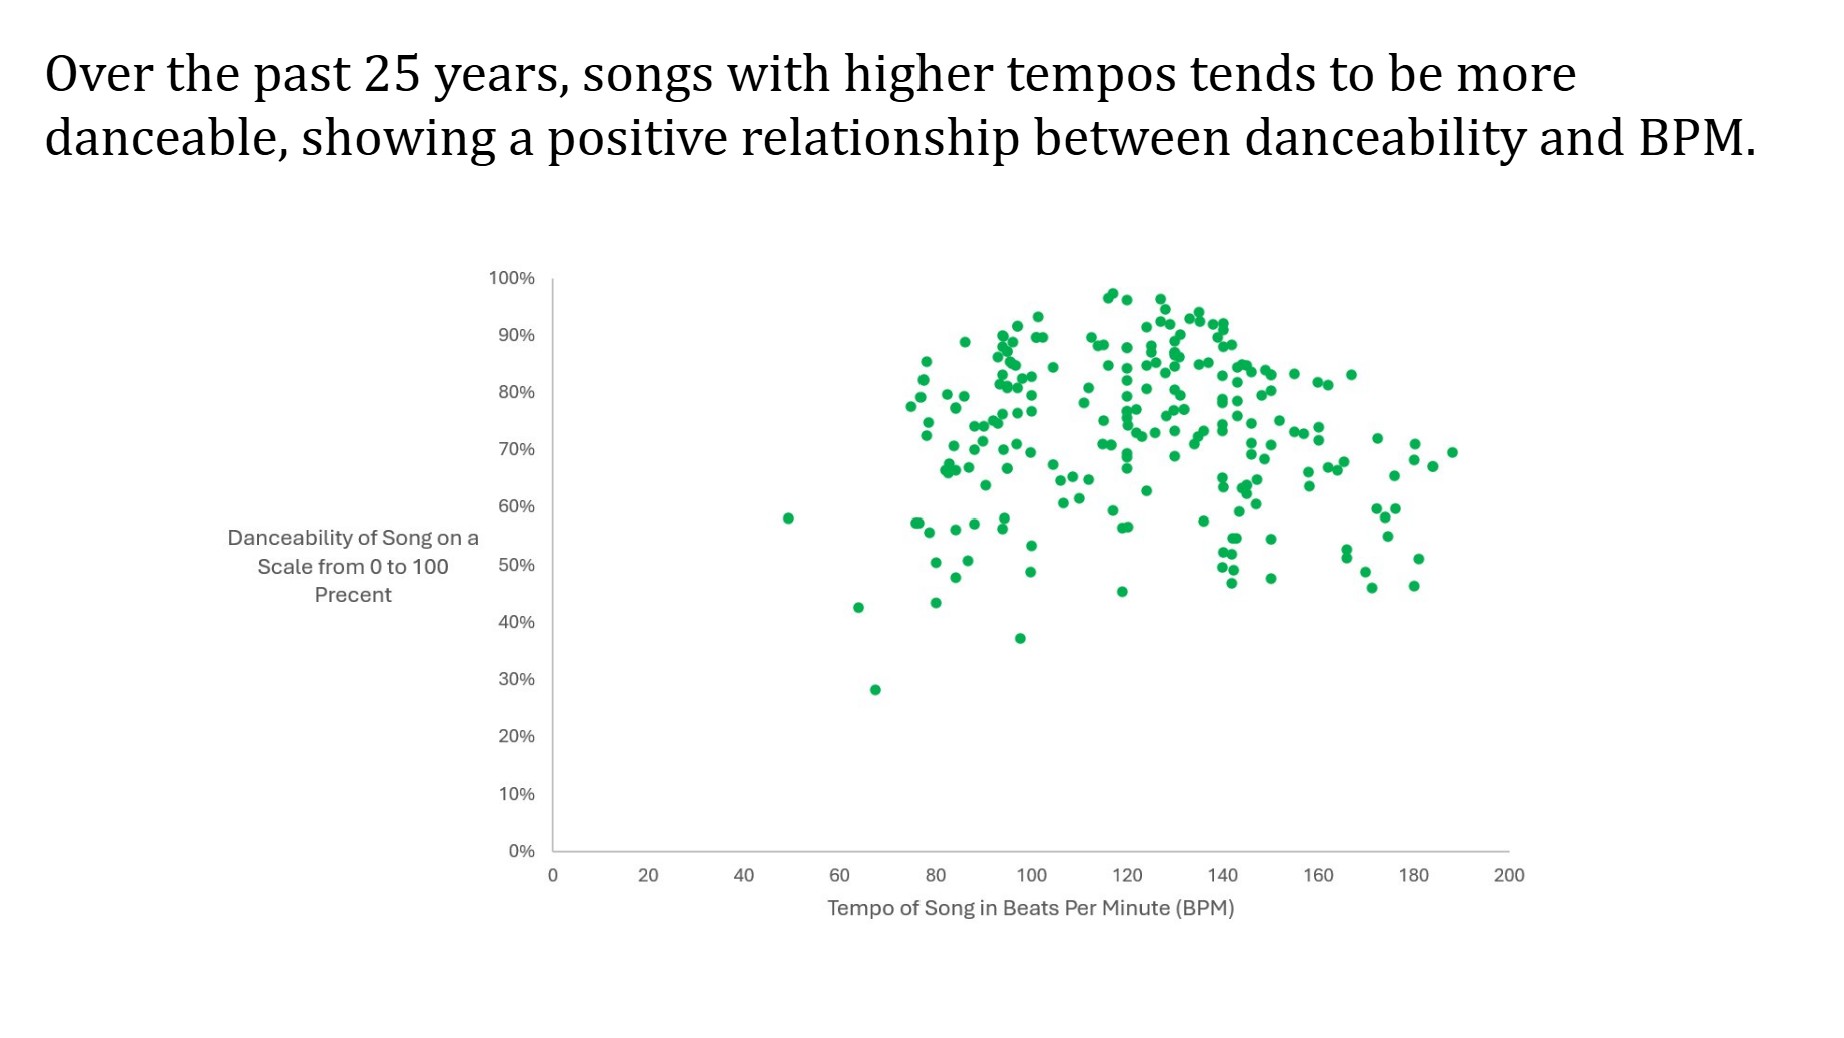
How does the tempo of a song effect its danceability score? We were curious to see if a song with a high tempo produced a high danceability score. For this question, we used Excel and filtered the data to only include the last 25 years. Then we used this filtered data to make a scatter plot to show the relationship between the tempo of a song in Beats Per Minute and the Danceability of the Song on a Scale from 0 to 100 Percent. The image above shows a positive relationship between the danceability and the tempo.